Personalised crafts and gifts store
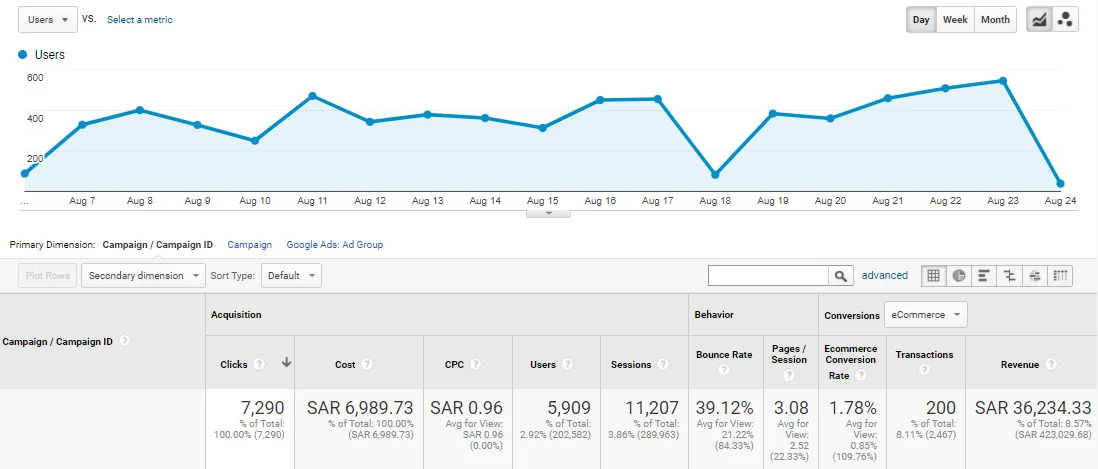
- SAR 36,234.33
- Google Ads revenue
- SAR 6,989.73
- Google cost
- 5.2:1
- ROAS
- 200
- Transactions
Google Analytics · Google Ads · August 2021, up to 24 August
A store selling necklaces, incense burners and gifts engraved with names. Personalised products need production time, so buyers order them weeks before the occasion.
I read Google inside Google Analytics alongside every source the store had, not inside the ad dashboard alone. That turned the ads’ share of revenue into a known number.
The challenge
A large store selling through many sources, which recorded SAR 423,029.68 from all of them over the same period. The question was not whether the store sold, but how much the paid ads actually added.
What I found
Reading Google inside Analytics showed its real share: 8.57% of store revenue in the period, at a 5.2 return on its cost. A smaller number than "all sales", but one that can be defended.
What I did
- I ran two Google campaigns: a search campaign for the store, and a dynamic ad that follows what people search for among its products.
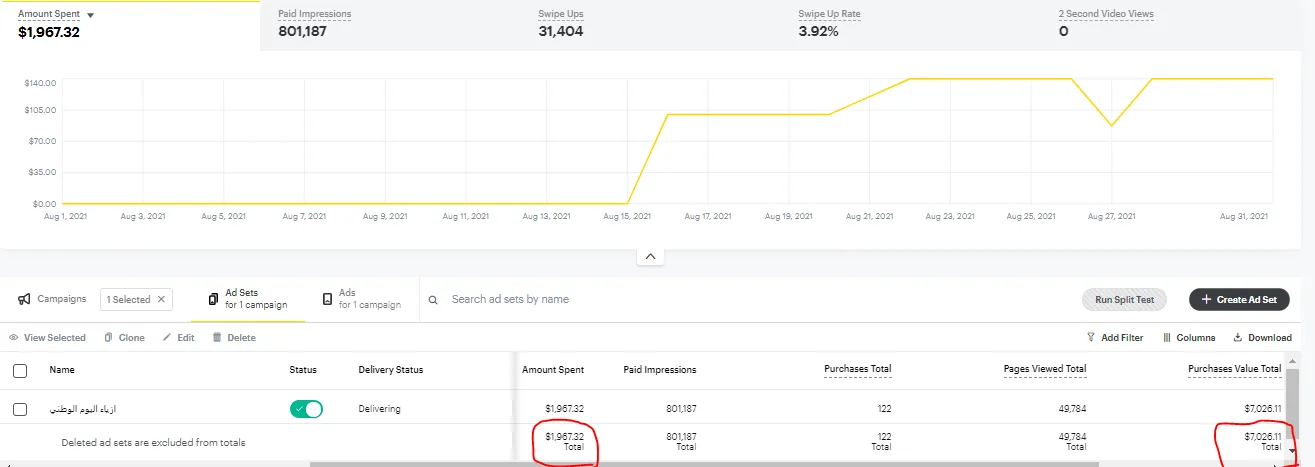
- I launched a National Day fashion ad set on Snapchat on 16 August 2021, more than five weeks before the occasion.
- I raised its daily budget a week after launch, once it had shown it was selling.
The results
- Google Ads revenue, August 2021
- SAR 36,234.33 on SAR 6,989.73
- Transactions from Google
- 200 at a 1.78% conversion rate
- Google’s share of store revenue
- 8.57% of SAR 423,029.68
- Snapchat, National Day ad set, August 2021
- 122 purchases worth $7,026.11 on $1,967.32
- Snapchat return, August 2021
- 3.6:1
The evidence
What this means for your store
If your store sells through many sources, ask for the ads’ share of revenue, not total sales. And if your product is made after the order, your season starts weeks before the occasion.
A large store does not need ads that claim all its sales. It needs ads that know their share of them. And a product made after the order sells before its season, so an ad that waits for the day arrives after people have bought.
Have a similar account?
Book your free consultation