Men’s fabrics store
- SAR 34,017.41
- Store revenue
- SAR 14,464.14
- Three weeks before
- +135.18%
- Revenue growth
- 117 vs 68
- Transactions
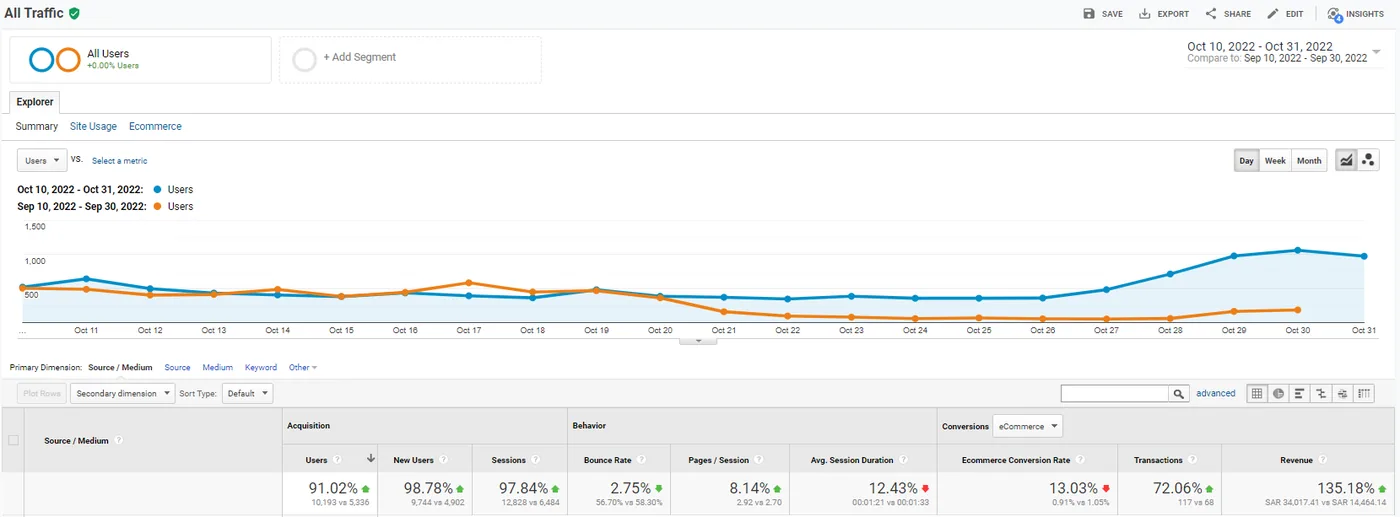
Google Analytics · all sources · 10 to 31 October 2022 vs 10 to 30 September 2022
An online store selling fabric for men’s thobes and shemaghs, by the piece and in bundles. I launched its Google and Instagram ads on the same day, after the storefront was refreshed.
I split each Instagram campaign into two ad sets, one for women and one for men. The women’s ad set turned out to be the one selling, so the budget moved there.
The challenge
A men’s fabrics store that recorded 68 transactions in three weeks of September 2022. The goal was to grow without spending on an audience that does not buy.
What I found
The product is for men, but the ad set aimed at women was the one selling. In November’s new-audience campaign, women brought 44 purchases against 3 from men.
What I did
- I launched sales campaigns on Google and Instagram on 10 October 2022.
- I split the Instagram campaign into a women’s and a men’s ad set, so I could read each audience on its own.
- I built a separate retargeting campaign for people who visited the store without buying.
- I raised Instagram’s daily budget from SAR 100 to SAR 180 in November, and stopped Google on 13 November.
The results
- Store revenue, 10 to 31 October 2022
- SAR 34,017.41 against SAR 14,464.14 before
- Transactions in the two periods
- 117 vs 68
- Users in the two periods
- 10,193 vs 5,336
- Conversion rate in the two periods
- 0.91% vs 1.05%
- The two Instagram campaigns, November 2022
- 87 purchases worth SAR 18,833.69 on SAR 3,959.29
- Google, 1 to 13 November 2022
- 11 sales worth SAR 3,955 on SAR 1,728
The evidence


What this means for your store
If your store sells a product for one gender, do not assume the buyer is the same gender. Split the audience and let the numbers say who pays.
October’s revenue growth came from more visits, not better conversion: the conversion rate fell from 1.05% to 0.91%. So I did not settle for the headline number. In November I moved the budget to the channel and audience that were actually selling, and stopped what was not.
Have a similar account?
Book your free consultation