Kitchenware and restaurant supply store
- SAR 306,430
- Google revenue
- SAR 40,109
- Google spend
- 7.6:1
- ROAS
- 782
- Orders
Google platform figures only · July 2022 to January 2023
A five-branch kitchenware and restaurant supply store selling across several platforms. The account looked stable, then sales dropped sharply with no obvious change in the ads.
I did not start by changing ads. I checked measurement first and found that Google Tag Manager had been deleted from the store, cutting off the conversion signal.
The challenge
An account that had been stable for a year, then recorded sales dropped sharply in the first days of January. Nothing had changed in the ads, the targeting, or what competitors were doing.
What I found
I looked at the campaign first and found nothing, so I moved to measurement. A tracking line had been deleted from the store, the conversion signal had stopped arriving, and the campaign was still optimising toward an objective it could no longer see.
What I did
- I checked measurement before blaming the campaign, and the deleted tracking line surfaced.
- I reinstalled it, then fired the event myself and confirmed it arrived before relying on it.
- I paused the Snapchat campaign and moved its budget to Google, where the return was higher.
- I stopped a Twitter test at SAR 199 after 43,019 clicks produced no sale.
The results
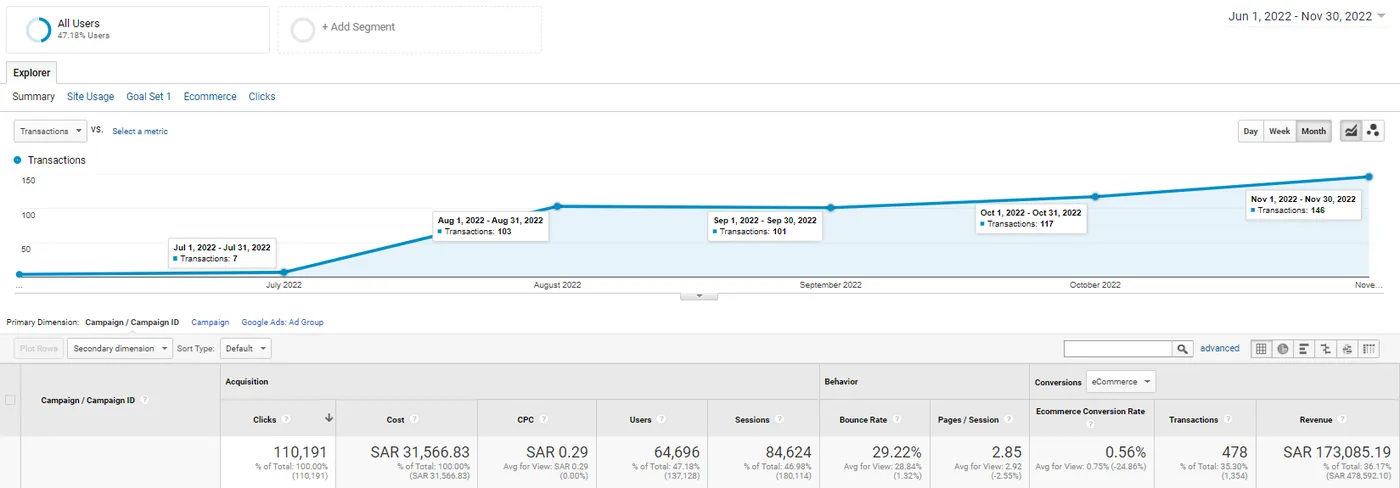
- Google revenue
- SAR 306,430
- Google spend
- SAR 40,109
- Google ROAS
- 7.6:1
- Orders
- 782
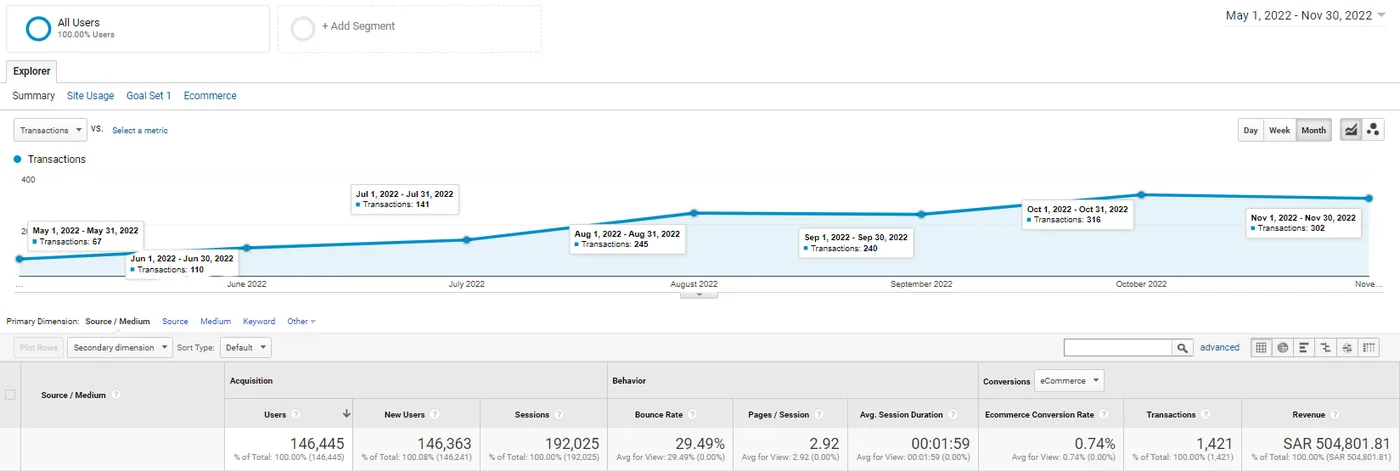
- Total across four platforms
- SAR 410,204 on SAR 98,725 · 4.2:1
The evidence

What this means for your store
If sales suddenly fall, the riskiest move is to react only inside the ad platform. Sometimes the campaign is fine and the signal it learns from is broken.
When numbers collapse suddenly, check measurement before you blame the campaign. Most people I have seen in this position either raise the budget or rebuild the campaign, and both deepen the loss because the fault is not there.
Have a similar account?
Book your free consultation